California Wildfires: Is Global Warming Producing a New Normal? Part 1: Are CA Wildfires Becoming More Frequent?

With major fires burning in California, the media is abuzz with stories suggesting or stating that global warming is the key driver of these big burns.  Some media reports state that the number of California fires and the annual burn area are increasing and that global warming is the cause.    California's Governor Jerry Brown is absolutely explicit about the climate-wildfire connection, claiming that global warming is creating a "new normal" of increased wildfires and that the population will have to get used to it.

Are these claims really true?  What does actually fire data show?  The truth may surprise many.


In this blog, we will consider whether the number of fires and the acreage burned in California have increased dramatically during recent years.  

If this is true, we can discuss why--- it could be climate change, mismanagement of forests, change in fire suppression policy, increased human ignition of fires, people living in places they had not before, invasive flammable species, are some possibilities.

If there is no trend in wildfires, we can examine why.

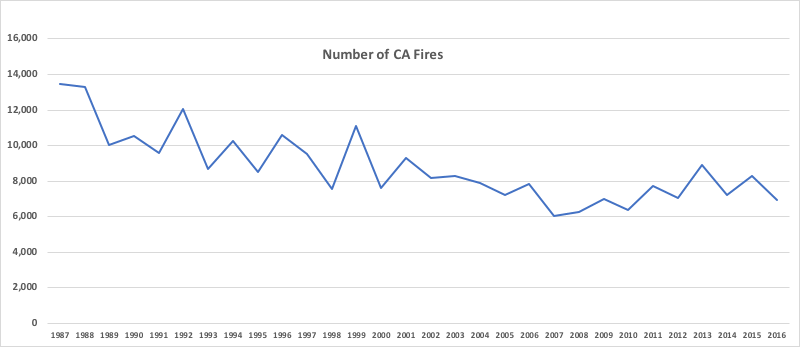
Let us first consider the wildfire statistics by CALFIRE, the official group in the State of California responsible for the numbers, which suggests a very different story provided by the media and many politicians.  The numbers I will show include the entire state.

CALFIRES statisitics show that the numbers of California wildfires over the past 30 years has declined--dropping roughly in half.


For the same 30 years (1987-2016), wildfire area has grown slightly, with huge transient peaks and troughs (see below).   With such variability, I suspect the trend would not be significant.  Final statistics for 2017 are not yet available on the CALFIRE website.


A longer-period (one century) view of wildfire frequency and area in California is found in a nice paper by Keeley and Syphard in the International Journal of Wildfire Science:  “Different historical fire–climate patterns in California”.  They break down the fires in two blocks:  (1) areas managed by the US Forest Service (USFS) and (2) the State of California (CAL FIRE).  Their results  (see below) suggest a maximum number of fires in the 1970s, followed by a substantial decline during the past decades.  

Repeat:  less fires recently.

 “Different historical fire–climate patterns in California” by Jon E. Keeley and Alexandra D. Syphard.
They also examined the areas burned during the last century.  For the US Forest Service areas (mainly the higher elevation regions) that encompass the northern part of the CA (where the big fires are burning now), the acreage was as large or larger at the beginning of the 20th century as now (see below), with a minimum around 1960. For the southern part of the state, the highest values are during the past few decades, with a secondary maximum early in the 20th century.

In contrast, for the Cal Fire areas, which encompasses lower elevations with greater overlap with human populations,  the largest areas burned occurred in the early part of the 20th century.    The only exception to this pattern is the south coast, where there is little trend.

The bottom line of the real fire data produced by the State of California and in the peer-reviewed literature is clear:  there has been no upward trend in the number of wildfires in California during the past decades.   In fact, the frequency of fires has declined.

And in most of the state, there has not been an increasing trend in area burned during the past several decades.

Yes....this and last year had some big fires, but a few years does not make a trend.


So there is a lot misinformation going around in the media, some environmental advocacy groups, and some politicians.   The story can't be a simply that warming is increasing the numbers of wildfires in California because the number of fires is declining.  And area burned has not been increasing either.

But now we get into the real interesting questions that many are not considering.   What is driving the ups and downs in wildfires?  There are so many factors that must be considered, such as:

1.  The fact that extensive fires are a natural historical part of the ecology of the region
2.  The impacts of a huge increase of human population, creating increasing vulnerability while humans are starting most of the fires.
3.   Climate change that causes warming and changing the precipitation patterns (both wetter and drier) that influence fire frequency and size.
4.  Mismanagement of our forests and wild areas, allowing tree and debris-choked landscapes
5.  Invasive and often highly flammable non-native species brought in by man (e.g., cheatgrass and Eucalyptus)

Clearly, climate change is only one possible factor in controlling fire frequency and may not be the most important.

More in future blogs.


<script async src="//pagead2.googlesyndication.com/pagead/js/adsbygoogle.js"></script>
<ins class="adsbygoogle"
     style="display:block"
     data-ad-format="fluid"
     data-ad-layout-key="-fz-11-1w-73+uq"
     data-ad-client="ca-pub-9105683284340755"
     data-ad-slot="5041557745"></ins>
<script>
     (adsbygoogle = window.adsbygoogle || []).push({});
</script>

Major Change in Northwest Weather: Rain Moves in, Smoke Moves Out

A strong upper level trough will move inland over the region tonight and tomorrow morning bringing cooling weather, clouds, some precipitation, and the removable of the smoke layer aloft.

To start,  here are the upper-level (500-hPa, about 18,000 ft) charts for the next few days.

This morning  (5 AM) shows a big ridge over the western U.S., but a strong closed low/trough offshore.


Tomorrow morning at 5 AM, the trough/low is moving into our coast.


The trough moves through on Saturday and then moves northeastward into Canada on Sunday (11 PM Sunday is shown below)


The initial approach of the trough is associated with enhanced southerly flow that brought up smoke from California, but as it passes, the winds will turn more westerly, driving the smoke to the east.  This progression is shown by the HRRR-SMOKE model output. This morning at 10 AM, there was fairly dense smoke aloft (see figure), but far less at the surface.


But by 2 AM, western Washington is clear, as the densest smoke moves over eastern WA and Idaho.


 Precipitation should start moving in by 5 AM, illustrated by the UW WRF model precipitation for the 3-h period ending that time.
 Heavier rain is predicted during the subsequent three hours, particularly along the coast, the Olympics, and SW Washington.


The showers move to the Cascades during the afternoon.

  And continue while slowly declining during Saturday evening.


Seattle will not got a lot from this event and we do expect some embedded thunderstorms.   Sunday should be dry and warmer (around 80F).

Finally, it is interesting to look back at the temperatures at Seattle Tacoma Airport during the last 12 weeks compared to the normal highs (purple) and normal lows (cyan).  We have had a series of heat waves during the past two months, with some intervening cool periods.
Clearly, this summer was warmer than normal, something shown graphically with the following map of the temperature differences from normal over the past 60 days.  Western WA has been 1-3F above normal, with California being even warmer (perhaps 3-4F above normal for the period).

Dense Canadian Smoke Veil Moves Southward over Washington State

There are many Canadian imports we value, such as maple syrup and wood products, but one we would rather do without:  smoke from major wildfires in British Columbia.  And a major push southward of Canadian smoke is occurring as I write this. 

The smoke was obvious in the MODIS satellite image around noon, with low clouds beneath the smoke, west of the Cascade crest.


Most of these clouds subsequently burned off, with lots of smoke still aloft (see picture for the GOES satellite around 4 PM)


The smoke was quite dense but was mainly aloft, leaving air quality decent near the surface.   But the sky is very hazy and the sun has that weakened yellow/red look to it.    For example, the latest image from the Seattle PanoCam shows the smoke clearly.


And those hiking at Sunrise on Mt. Rainier did not see blue skies.


Yesterday in contrast had very, very clear skies.  What happened?

The passage of an upper level low and trough. 

Prior to the low passage, there was lots of Canadian smoke aloft, since southerly flow precedes the upper level low (see my previous blog).  As the low passed yesterday, the winds aloft first were first southwesterly/westerly, bringing in clean air from off the Pacific). But as the low passed by, the winds became northerly aloft which moved smoke from fires in BC southward (see upper level, 500 hPa, about 18,000 ft, map at 5 AM Sunday, winds are shown by the wind barbs)


And the upper level map for tomorrow morning (11 AM Monday) shows that the northerly flow is not over.

As many of you know by now, I am a great enthusiast for the wonderful experimental HRRR-SMOKE model run by NOAA ESRL.  Here is the vertical total of smoke amount for 2 PM Sunday from HRRR-Smoke.  Red is very smoky.  You can see lots of smoke moving southward into NW Washington, with cleaner air over northern Oregon.  The California smoke wa heading to the east and then northeast, missing us.


 By 9 AM Monday, substantial smoke is over all of WA state and CA smoke is moving northward again into Oregon.


And by late Monday evening, the two smoke sources combine, producing substantial haze over the entire Northwest.


And now the bad news: the winds over the Cascades will become easterly tomorrow and eastern WA smoke will push westward over the Cascades, with smoke pushing down to the surface (see surface smoke forecast for tomorrow at 7PM).  Our decent air quality may be over---so if you are vulnerable, take the appropriate precautions.

The Great Irony: Cooler Weather in the West Means More Wildfires in the East

It always seems a great irony to me.  During the mid to late summer when western Washington cools down, wildfires explode over the eastern slopes of the Cascades.

But it all makes sense and is explained by lightning and winds.

By  the time we get to mid-summer (after approximately July 15th), many of the "fuels" along eastern slopes of the Cascades (e.g., dry grasses, bushes, logging slash, dead trees) are dry enough to burn.

To get a fire, first one need an igniter.  Humans start some fires: from fireworks, practice shooting, cars, cook fires, failing electrical systems, thrown cigarettes, and even arson.     These fires tend to be in relatively accessible locations (e.g., roadsides) that can be controlled quickly.

Lightning fires are the other major source of ignition in our region and these fires are often in inaccessible locations and often in larger timber.

This week there was lightning over Washington and southern BC, just as western Washington went through a cool down period.

For example, the 24 hr ending 1 AM August 27th.

 More range on the 28th.
 Lots over the Cascades for the 29th.
And substantial amounts of southern BC for the 24 hours ending 1 AM on August 1.


The lightning resulted from the passage of an upper level trough (see map for 500 hPa on July 28th at 8 AM) that produced upward motion and unstable conditions over us.


This trough produced some cooling and the lightning initiated some fires.  Then another trough moved in yesterday (see below) and resulted in a deepening marine layer, with the enhanced layer of cool air associated with high pressure over the western portion of the state and a larger pressure difference (gradient) across the State.  Winds accelerated in gaps in the Cascades, the Cascade crest and the lee slopes on the eastern side.  


To illustrate here are the max winds yesterday across WA state. Light winds over the west (gusts to 10-15 mph), but lots of 30-40 mph on the eastern side of the mountains, with some getting to 50 mph!


Max temperatures were way cool yesterday over the western half of Washington, but still toasty (90sF) over the east (see below).   Relative humidities remained low over eastern WA as well.

So troughs brought lightning initiation of fires and then produced strong, gusty winds that stoked and drove the fires during the last few days.

How many fires now?  Here is the latest map from the NW Wildfire Interagency Coordination Center. Several of the ones along the eastern slopes of the Cascades are the lightning/wind fires.


As the west warms during the weekend, the winds should weaken and the only lightning expected will be with some weak thunderstorms over the Cascade crest.
So conditions will be generally favorable for controlling the current fires and hopefully not initiating new ones.

It is essential for humans not to initiate fires in this period when lightning will be subdued.

Warmer Weather and More Smoke Ahead

Warmer Weather and More Smoke Ahead


Seattle PanoCam images at 6:10 and 6:30 AM Monday morning looking northwest from the Space Needle --the eastward-moving smoke is obvious

Our cool respite with little wildfire smoke is over.

High pressure is building over the inland western U.S., resulting in increasing offshore and southerly flow that will bring more smoke into western Washington.

Currently, there are a number of small and moderate-size fires burning over the Northwest (see map), plus plenty in California (see image).

High pressure starts building along the West Coast (see upper level map for Tuesday morning).

At the surface, high pressure will be building inland, resulting in easterly flow and the development of a thermal trough (low pressure) extending and amplifying from CA to WA (see surface map at 2 AM Wed).

These changes will produce increasing flow from the south and east that will move smoke our way.  The smoke map from the NOAA HRRR smoke system for 5 PM (below) shows eastern WA smoke pushing into the eastern side of the lowlands....which was very obvious if you looked eastward towards the Cascades today.


The situation worsens by 5 PM Monday (see below) as massive amounts of California and SW Oregon smoke pushes northward.  Skies will get hazy and the sun weakened.


Finally, by 11 AM on Tuesday, relatively dense smoke from CA and southern Oregon will extend over our region.   Our air quality at the surface will depend critically on how much of this smoke mixes down to the surface.


There was a large amount of lightning yesterday associated with thunderstorms over the Cascades (see below)..... I am worried that some of these strikes might have started new fires.

3D Smoke

Satellite imagery shows smoke moving in over head (see below) and our sunsets/sunrises confirm it.


But yet the air quality is very good near the surface, something shown by the measurements of the Puget Sound Clean Air Agency (see below), with the near sea level sites being green (good air quality).   But note that Rainier and a few sites near the Cascade slopes are yellow (moderate air quality)


In contrast, head down to California, and smoke has engulfed the lower atmosphere, as beautifully illustrated by the picture of the region around Mt. Shasta sent to me by Kean Stump.


The NOAA HRRR-smoke forecast predicted this situation. The forecast for total smoke in the column at 5 PM today was scary.


But the smoke forecast at the surface at the same time was pretty benign for the Puget Sound lowlands (see below).  Plenty of smoke in eastern Washington and California at low levels, though


In contrast, there was much more smoke predicted at 6000 ft.


The reason for this pattern?  There was northerly (from the north) winds at low levels over western WA, that brought in clean air from the north and west, while southerly flow aloft moved the California and Oregon smoke northward above us aloft---high enough that it wasn't mixed to the surface.

We can show this by creating backward trajectories of the air at various levels above Seattle--telling us where the air came from over us. This plot (from the wonderful NOAA HYSPLIT model) shows the trajectories ending over Seattle at three heights (100 meters--red, 1500 meters--blue, and 2500 m--green) at 5 AM this morning. The 100m trajectory moved through the Strait of Juan de Fuca...nice clean ocean air.  But the higher trajectories cam from the south (blue and green)--in the middle of smoke land.


We can also do forward trajectories that describe where air will go...here are the forward trajectories from a location over northern California, starting at the same three elevations.  The low-level smoky air (red) moves northward, while rising substantially (to about 4000 meters).  Less rising for air starting at 1500 meters.


The bottom line:  the low-level northerly flow is protecting us today, allowing the smoke to stay aloft.    

Whether we get smoke to the surface is critically dependent on how low the upper smoke layer drops.....if it gets below 5000 ft then vertical mixing can bring it down to the surface during the day.

The situation should be similar on Wednesday.....

New Podcast: Why is November the Stormiest Period of the Year and the Forecast for Next Week

  Believe it or Not! On average, we are now past the worst weather of the winter!  Shocking but true.  And in the second segment of my podca...